Start
Install
npm i bbl-gantt
# Install the @svgdotjs/svg.js library, which is a dependency of mark-img
npm install @svgdotjs/svg.js
Usage
UMD
<!DOCTYPE html>
<html lang="en">
	<head>
		<meta charset="UTF-8" />
		<meta name="viewport" content="width=device-width, initial-scale=1.0" />
		<title>Umd Test</title>
		<!-- import style -->

		<link rel="stylesheet" href="../dist/style.css" />
		<style>
			html,
			body {
				padding: 0;
				margin: 0;
			}
		</style>
	</head>

	<body>
		<div id="container" style="width: 100vw;height: 100vh;"></div>
		<!-- import @svgdotjs/svg.js library -->

		<script src="https://cdn.jsdelivr.net/npm/@svgdotjs/svg.js@latest/dist/svg.min.js"></script>
		<!-- import mark-img library -->
		<script src="../dist/index.umd.js"></script>
		<script>
			const Gantt = window['bbl-gantt'].Gantt
			const gantt = new Gantt({
				el: '#container',
				data: [
					{
						name: '1',
						bg: '#23C343',
						events: [
							{
								name: '1-event-1',
								start: '2022-01-01 09:00:00',
								end: '2022-01-01 09:10:00',
								color: 'yellow',
								textColor: 'yellow',
							},
							{
								name: '1-event-1',
								start: '2022-01-01 09:10:10',
								end: '2022-01-01 09:20:00',
							},
						],
					},
				],
				column: {
					width: 10,
					timeMetric: 18000,
				},
			}).on('init', () => {
				console.log('init')
			})
		</script>
	</body>
</html>
ES
import Gantt from 'bbl-gantt'
// import style
import 'bbl-gantt/dist/style.css'

const gantt = new Gantt({
	el: '#container',
	data: [
		{
			name: '1',
			bg: '#23C343',
			events: [
				{
					name: '1-event-1',
					start: '2022-01-01 09:00:00',
					end: '2022-01-01 09:10:00',
					color: 'yellow',
					textColor: 'yellow',
				},
				{
					name: '1-event-1',
					start: '2022-01-01 09:10:10',
					end: '2022-01-01 09:20:00',
				},
			],
		},
	],
	column: {
		width: 10,
		timeMetric: 18000,
	},
}).on('init', () => {
	console.log('init')
})
gantt chart components
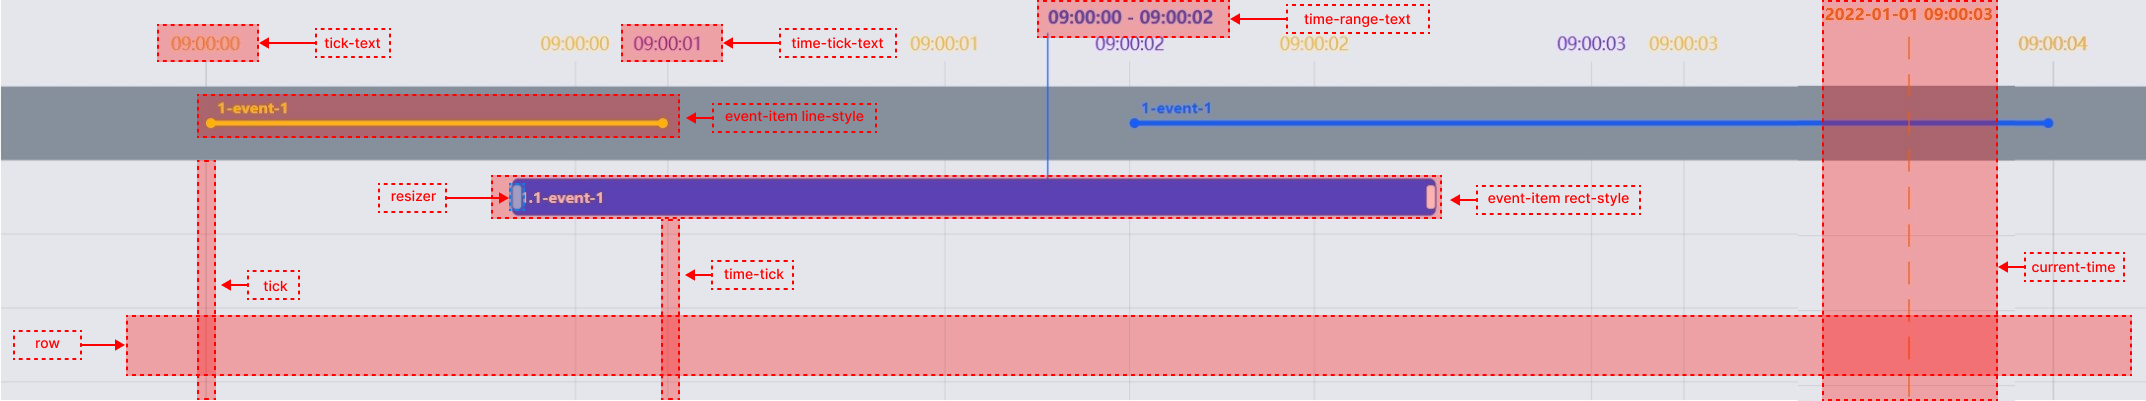
tick
Time scale line, which is set by column.timeMetric in options.
tick-text
The time scale line corresponds to the time displayed in the header.
tick
time-tick
A reasonable integer time automatically calculated based on the tick time interval, such as a 30-minute interval, the rendering is performed in hours, and if the interval is less than 15 minutes and greater than 3 seconds, the rendering is performed in minutes.
time-tick-text
Integer time scale line corresponds to the time displayed in the header.
row
Row, a row can have multiple event items
event-item
event-item, which describes the duration of an event. Currently, two styles are supported,line and rect.
time-range-text
When the event item changes the time size, moves, or creates, the time range of this event item is displayed.
current-time
Display the current time when clicked in the non-event items area of the Gantt Chart